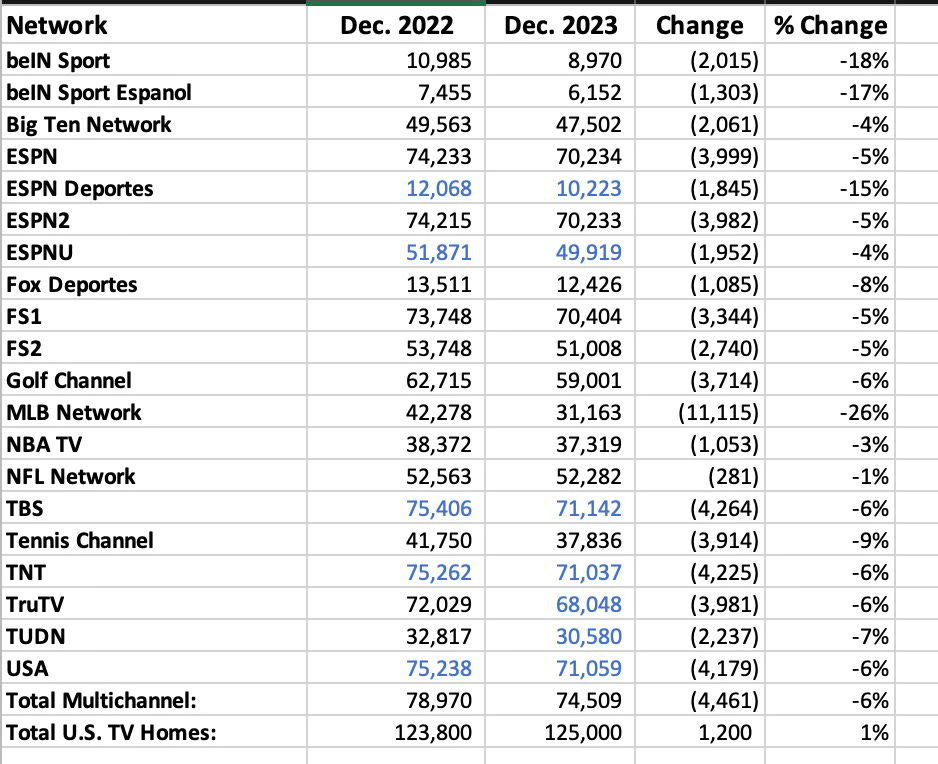
Nielsen's December Cable Coverage Estimates (how many homes the networks are available in)
ESPN & FS1 down another 5% in the past year.
Note: these numbers, sadly, require a little more explanation than they used to but the short-ish version is that ESPN Deportes, ESPNU, TBS, TNT, truTV, TUDN and USA use, to varying degrees (ESPNU & TUDN a significant degree, the rest, a smaller one). dynamic ad insertion (DAI) with streaming bundles like (and mostly) YouTube TV.
The numbers in blue below represent networks that utilize DAI (TruTV and TUDN do now, but didn’t last December). More explanation follows the chart, but hopefully this chart is a little more useful and a lot easier on the eyes than my prior attempts.
(numbers in thousands, i.e. 70,234 for ESPN in December 2023 = 70,234,000)
It took a while but it looks like Nielsen is finally accounting for MLB network no longer being available on YouTubeTV!
Below is the traditional/non-linear breakout for the networks utilizing DAI with the streaming services. Importantly, only the households in the Traditional column are used for Nielsen ratings measurement purposes. Like it or not (and I know some don’t like it at all!) the purpose of national Nielsen measurement is to broker national advertising sales and the dynamically inserted ads aren’t national.
In thousands (000)
I think the first chart at the top is a bit more important because it includes total distribution (traditional + non linear) and if you’re going to estimate the # of homes those networks are available in and getting paid monthly fees based on, that’s the way to go. Also, particularly with truTV and TUDN, who use DAI now but didn’t a year ago, the declines would look MUCH WORSE than they really are if you used only the traditional homes, and the numbers look bad enough without all that.


So are you saying YouTube TV viewers don't count towards Nielsen?