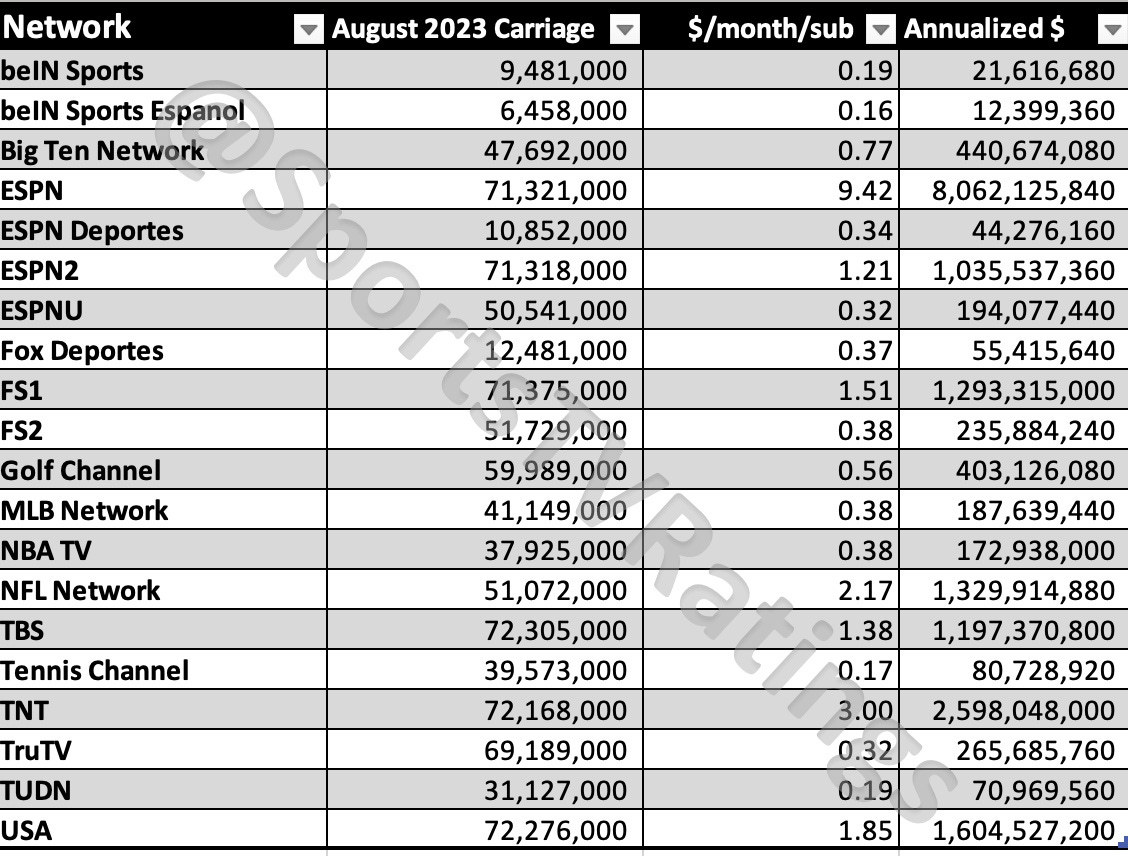
A SWAG at estimated revenue per cable sports network
SWAG = scientific wild-assed guess
To anyone receiving this by e-mail who doesn’t remember signing up for this Substack: I decided to go with the SportsTVRatings brand and I migrated over anyone who’d subscribed to internetcompost.substack.com, where I’d previously posted these kind of things.
This is a pretty straightforward SWAG at annualizing revenue per sports network based on:
SNL Kagan’s/S&P Global’s monthly affiliate fee/subscriber/network estimates
Nielsen’s August 2023 cable coverage estimates
…and then multiplying them together and by 12 to get the annualized rates.
I’m not sure how useful multiplying estimates by estimates is, but regardless, I think it’s at least a pretty good directional proxy of how the networks fare relative to each other.
Note: you may have seen numbers for Nielsen August estimates elsewhere that were a bit smaller. Those smaller numbers are correct as far as the number of households for national TV ratings/national advertising purposes. But, several networks use some dynamic ad insertion (DAI) with some of the streamers (YouTube TV, etc) and those households are carved out of the traditional national advertising-based Nielsen accounting.
But, since those households are still collecting monthly fees and Nielsen says you should include them whenever discussing total national footprints, I’m including them here.
It makes no difference for ESPN and FS1, since neither use DAI. But TBS, TNT, truTV and USA all dabble with it. ESPNU and TUDN do more than dabble, 26% of ESPNU and 27% of TUDN footprints were on DAI in August, per Nielsen.


Is the Big Ten Network carriage fee a blended average? As I recall, they charge one carriage fee for states with a Big Ten school or adjacent to such a state and a somewhat lower carriage fee in other states.